A couple days ago, during my Sabermetrics 101 class (free online class offered by Boston University, I highly recommend), the topic was how to convert runs to wins. The team with the most runs wins a baseball game, as such, runs are the currency of baseball. While learning this, I pondered if the same statement could be applied to hockey and came to the obvious conclusion that goals (not shot attempts/Corsi events or unblocked shot attempts/Fenwick events) are the currency of hockey (with the exception of wins wrought by the shootout). Back to baseball, using runs, pioneer of sabermetrics, Bill James used the following formula, using pythagorean expectation, to predict winning percentage – W/(W+L):

What would be the results if we swapped out runs scored for goals for and runs allowed for goals against? Before I get to the results, I’ll present how the pythagorean expectation for goals (we’ll call this PEG) compares to Points % (points divided by maximum points) for each team last season:
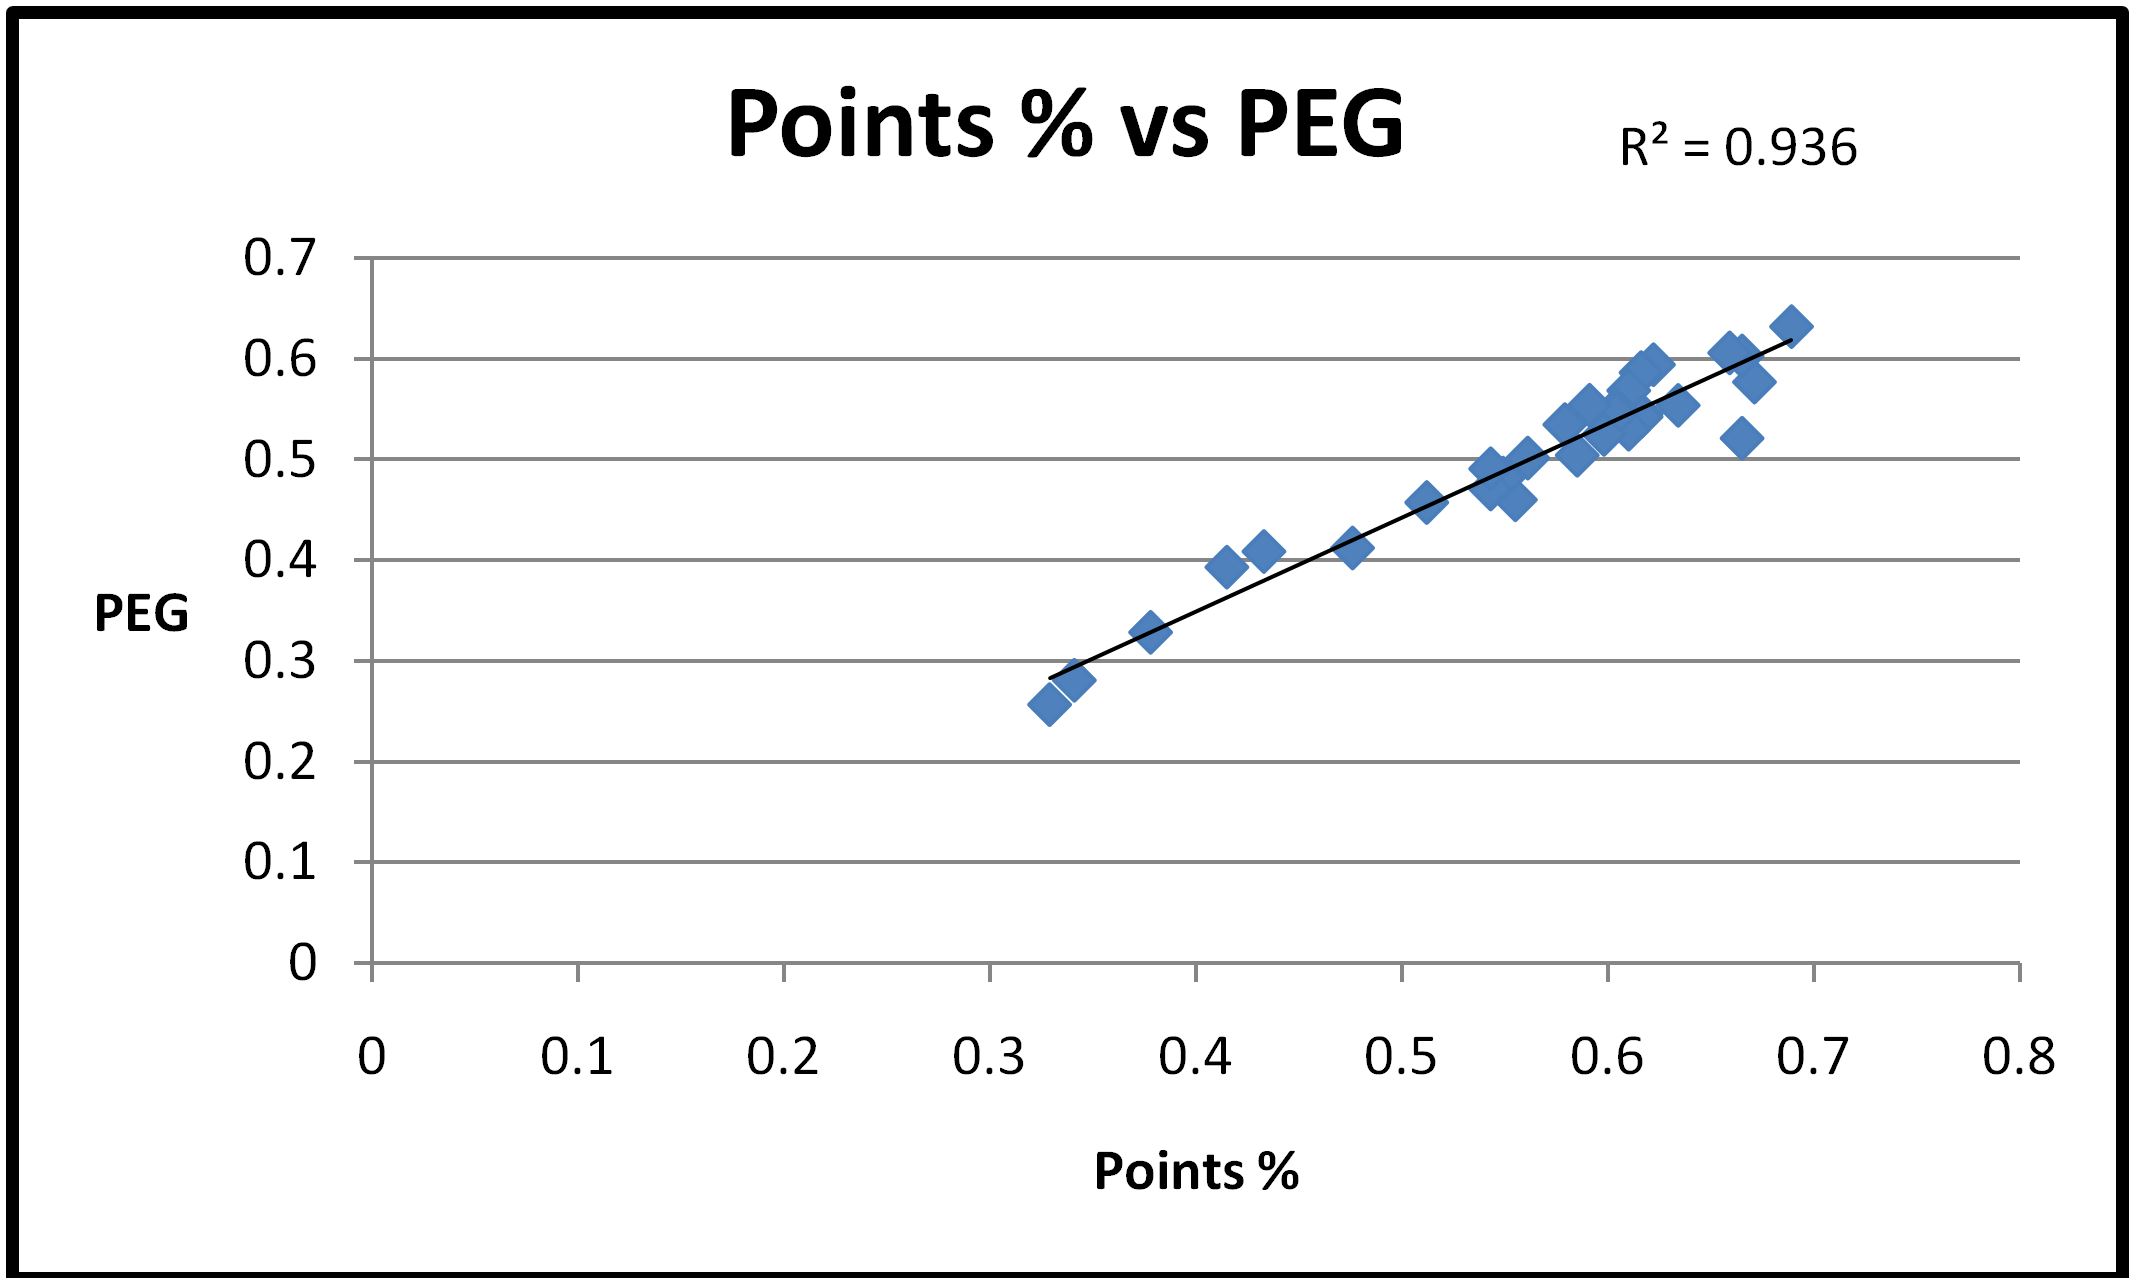
As is illustrated here, Points % is highly correlated to PEG. Additionally, from the R-squared value, we can conclude that 93.6% of the variation in Points % can be explained by PEG. Personally, I would say that the remaining 6.4% can plausibly be explained by shootouts and luck. So with PEG, we have a number that tells us how a team should have performed. To easier illustrate non-luck-based standings, I converted PEG to Points** to see the difference between the actual points that teams had during the course of last season. I made sure to add a column that shows the change in these rankings, this shows teams that overachieved/had luck go their way in the regular season (if this number is negative) and teams that underachieved/had luck go against them in the regular season (if this number is positive). This is all presented below (sorted by PEG Points):
| Rk (in actual points) | Team (* means made playoffs) | W | L | OL | PTS | PTS% | GF | GA | PEG | PEG Points | Change (PEG Points-Actual Points) |
| 1 | New York Rangers* | 53 | 22 | 7 | 113 | 0.689 | 252 | 192 | 0.633 | 113.93 | 0.93 |
| 5 | Tampa Bay Lightning* | 50 | 24 | 8 | 108 | 0.659 | 262 | 211 | 0.607 | 109.65 | 1.65 |
| 4 | St. Louis Blues* | 51 | 24 | 7 | 109 | 0.665 | 248 | 201 | 0.604 | 109.15 | 0.15 |
| 7 | Chicago Blackhawks* | 48 | 28 | 6 | 102 | 0.622 | 229 | 189 | 0.595 | 107.72 | 5.72 |
| 10 | Washington Capitals* | 45 | 26 | 11 | 101 | 0.616 | 242 | 203 | 0.587 | 106.43 | 5.43 |
| 2 | Montreal Canadiens* | 50 | 22 | 10 | 110 | 0.671 | 221 | 189 | 0.578 | 104.89 | -5.11 |
| 12 | Minnesota Wild* | 46 | 28 | 8 | 100 | 0.61 | 231 | 201 | 0.569 | 103.50 | 3.50 |
| 16 | Calgary Flames* | 45 | 30 | 7 | 97 | 0.591 | 241 | 216 | 0.555 | 101.11 | 4.11 |
| 6 | Nashville Predators* | 47 | 25 | 10 | 104 | 0.634 | 232 | 208 | 0.554 | 101.09 | -2.91 |
| 13 | Ottawa Senators* | 43 | 26 | 13 | 99 | 0.604 | 238 | 215 | 0.551 | 100.47 | 1.47 |
| 8 | New York Islanders* | 47 | 28 | 7 | 101 | 0.616 | 252 | 230 | 0.546 | 99.64 | -1.36 |
| 14 | Winnipeg Jets* | 43 | 26 | 13 | 99 | 0.604 | 230 | 210 | 0.545 | 99.61 | 0.61 |
| 9 | Vancouver Canucks* | 48 | 29 | 5 | 101 | 0.616 | 242 | 222 | 0.543 | 99.22 | -1.78 |
| 18 | Los Angeles Kings | 40 | 27 | 15 | 95 | 0.579 | 220 | 205 | 0.535 | 97.95 | 2.95 |
| 11 | Detroit Red Wings* | 43 | 25 | 14 | 100 | 0.61 | 235 | 221 | 0.531 | 97.20 | -2.80 |
| 15 | Pittsburgh Penguins* | 43 | 27 | 12 | 98 | 0.598 | 221 | 210 | 0.526 | 96.35 | -1.65 |
| 3 | Anaheim Ducks* | 51 | 24 | 7 | 109 | 0.665 | 236 | 226 | 0.522 | 95.72 | -13.28 |
| 17 | Boston Bruins | 41 | 27 | 14 | 96 | 0.585 | 213 | 211 | 0.505 | 92.94 | -3.06 |
| 19 | Dallas Stars | 41 | 31 | 10 | 92 | 0.561 | 261 | 260 | 0.502 | 92.48 | 0.48 |
| 23 | San Jose Sharks | 40 | 33 | 9 | 89 | 0.543 | 228 | 232 | 0.491 | 90.74 | 1.74 |
| 21 | Colorado Avalanche | 39 | 31 | 12 | 90 | 0.549 | 219 | 227 | 0.482 | 89.23 | -0.77 |
| 22 | Columbus Blue Jackets | 42 | 35 | 5 | 89 | 0.543 | 236 | 250 | 0.471 | 87.45 | -1.55 |
| 20 | Florida Panthers | 38 | 29 | 15 | 91 | 0.555 | 206 | 223 | 0.460 | 85.68 | -5.32 |
| 24 | Philadelphia Flyers | 33 | 31 | 18 | 84 | 0.512 | 215 | 234 | 0.458 | 85.24 | 1.24 |
| 25 | New Jersey Devils | 32 | 36 | 14 | 78 | 0.476 | 181 | 216 | 0.413 | 77.82 | -0.18 |
| 26 | Carolina Hurricanes | 30 | 41 | 11 | 71 | 0.433 | 188 | 226 | 0.409 | 77.24 | 6.24 |
| 27 | Toronto Maple Leafs | 30 | 44 | 8 | 68 | 0.415 | 211 | 262 | 0.393 | 74.69 | 6.69 |
| 28 | Edmonton Oilers | 24 | 44 | 14 | 62 | 0.378 | 198 | 283 | 0.329 | 64.06 | 2.06 |
| 29 | Arizona Coyotes | 24 | 50 | 8 | 56 | 0.341 | 170 | 272 | 0.281 | 56.24 | 0.24 |
| 30 | Buffalo Sabres | 23 | 51 | 8 | 54 | 0.329 | 161 | 274 | 0.257 | 52.26 | -1.74 |
Adam is a student at McGill University. You can follow him on Twitter @adam_m3318.
You can follow Hit the Cut on Twitter @hitthecutblog.
**PEG was converted to points by adjusting the mean PEG to match the mean of the actual Points % (by adding a season-specific constant number to each team’s PEG – for this season it was 0.062). I then multiplied this number by 164 (the maximum amount of points possible for a team in a season).

One thought on “Looking at Last Season’s NHL Standings Using Pythagorean Expectation”